APPLICATIONS · ENGINE OIL ANALYSIS
Every wear event, every batch of contaminated make-up oil and every hour of over-extended service leaves a record in the lubricant, and engine oil analysis is how you read that record. On haul trucks, excavators, long-haul tractors and standby generators the arithmetic is blunt: an unplanned failure costs many times what a planned repair costs, while an oil sample costs a fraction of either. This guide walks you through what engine oil analysis is for, how to sample and how often, how you read the key indicators, what oil signatures common failures leave, what to do when a result looks abnormal, and the practices that work on heavy equipment.
Soohow Instrument Technical Team · Published 2026-10-12
What Engine Oil Analysis Is and Why It Matters for Heavy Equipment
Engine oil analysis, often called used oil analysis once the oil is in service, means drawing a representative sample from a running engine and measuring it on site or in a laboratory: metal elements, physical and chemical properties, contamination level and wear particle morphology. It answers three questions: is your oil still fit for service, is your machine wearing abnormally, and has something entered the oil that should not be there? An oil change is an action, a test is a measurement, and condition monitoring is the ongoing practice of using measurements to decide when work happens.
Heavy equipment makes the case sharper than most applications. Duty cycles are severe, drains are long, and the working environment supplies dust, water and thermal load in abundance, while a stoppage on your haul truck or standby generator is expensive and hard to predict. Running to a fixed hour count loses twice: you drain healthy oil early, and you leave degraded oil in the sump.
Note. Engine oil analysis complements the manufacturer's maintenance schedule; it does not replace it. OEM intervals and warranty terms remain the baseline, and oil data is what lets you move within that baseline on evidence rather than guesswork.
The Key Indicators and What They Tell You in Engine Oil Analysis
A report carries many values, but most belong to four families, each answering a different question about your machine.
| Indicator | What a change points to | Why it matters on heavy equipment |
| Iron (Fe) | Ferrous wear from liners, rings, crankshaft and gears | A rising trend is one of the earliest signs of accelerating wear |
| Copper (Cu), lead (Pb), tin (Sn) | Bearing and bushing wear | Points to bearing distress before it becomes a failure |
| Aluminium (Al), chromium (Cr) | Pistons, turbocharger parts, plated liners and rings | Narrows wear to a specific assembly |
| Silicon (Si) | Ingested dust | Air filtration or intake leakage in a dusty environment |
| Sodium (Na), potassium (K) | Coolant ingress, or seawater in marine duty | Cooling system or seal leakage |
| Viscosity rising | Oxidation, soot, over-extended drain | Poorer cold flow and more load on the oil pump |
| Viscosity falling | Fuel dilution | Weaker oil film and accelerated wear |
| Base number falling, acid number rising | Additive depletion and base oil oxidation | Less acid neutralising capacity, higher corrosion risk |
| Water content rising | Condensation, coolant ingress or washdown | Emulsification, rust and film breakdown |
| Particle level and ferrous debris | Cleanliness against a grading code, larger ferromagnetic particles | Filter performance, and wear that spectroscopy may miss |
Two rules govern how you read these values. No indicator has a universal normal value, because engine type, duty cycle, lubricant and drain history all move the range, so a figure only means something against your own unit's record. And the trend carries more than the absolute value: a reading inside a generic table is no comfort if it has doubled since your last sample.
Note. Spectroscopy is generally insensitive to particles larger than roughly 10 microns, and serious wear produces exactly those particles. Normal element values do not rule out large-particle wear; you need a ferrous debris or wear particle measurement to close that gap.
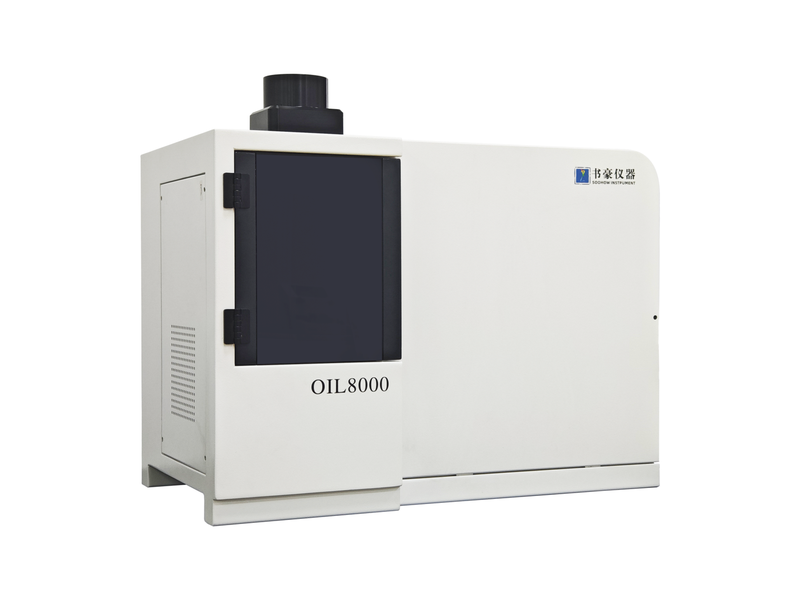
Oil spectrometer OIL8000: a full panel of elements from one sample
How Engine Oil Analysis Instruments Work Together
No single instrument completes an engine oil analysis. Several work in sequence, and the sequence carries the logic: from the smallest particles to the largest, from "something changed" to "here is what changed".
▍Element Screening: Which Metals Are Rising
An oil spectrometer works by atomic emission, exciting the metals in your sample and identifying them from their spectral lines; the rotating disc electrode method is described in ASTM D6595 and the inductively coupled plasma method in ASTM D5185. One sample gives you a full element panel: iron, copper, aluminium, chromium and lead describe wear, silicon describes ingested dust, and calcium, zinc, phosphorus and magnesium describe the additive package. Read as a series, you can tell which metals are rising, and whether they are wear metals or additives.
▍Oil Condition: Is the Oil Still Fit for Service
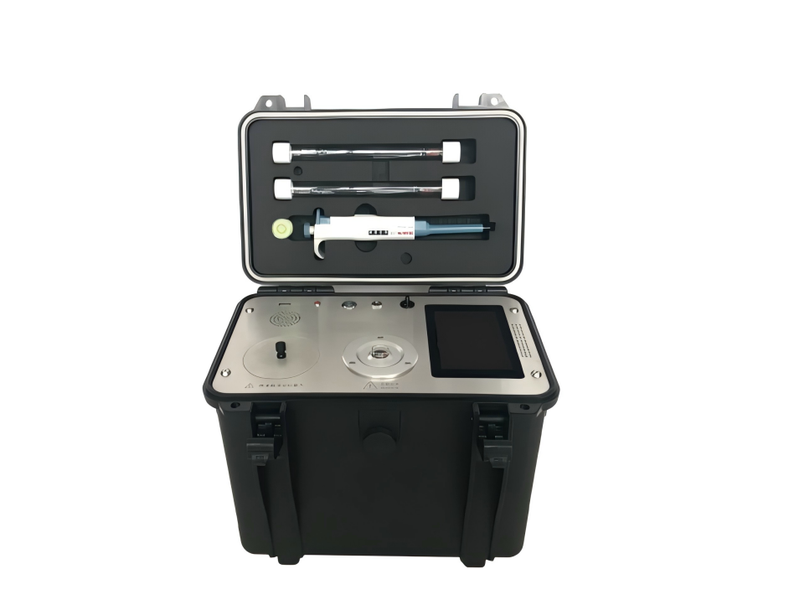
Viscosity under ASTM D445 shows you the direction of change. Water by coulometric Karl Fischer titration under ASTM D6304 shows you how much has entered. Base number by ASTM D2896 or D4739 and acid number by ASTM D664 show how far degradation has gone. FTIR under ASTM D7418 returns oxidation, nitration and soot in one scan, and portable versions let you judge in the field first, without waiting for a laboratory.
Portable kinematic viscometer VS600: on-site screening of oil condition
▍Contamination: Particles, Water and Coolant
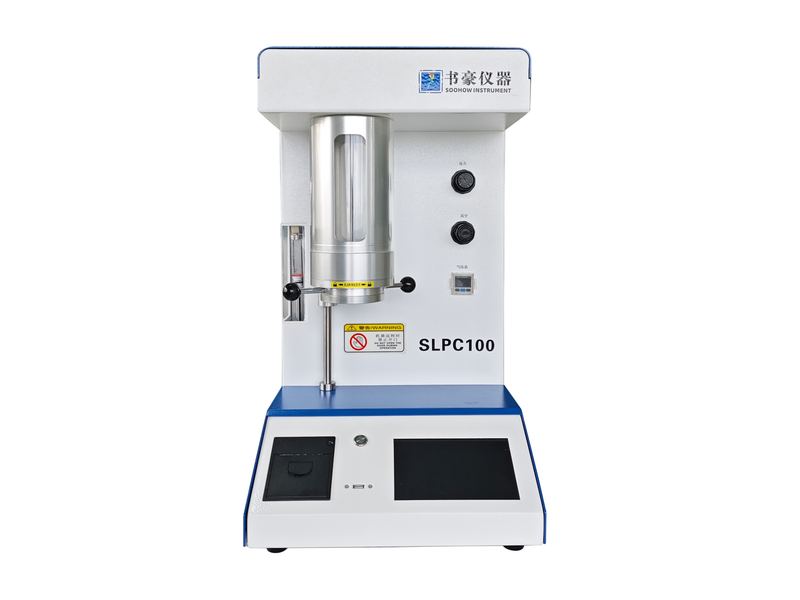
A particle counter reports cleanliness against a grading code such as ISO 4406, and before-and-after samples show you whether the change was worth it. Ferrous debris instruments, including the PQ index, quantify the larger ferromagnetic particles spectroscopy cannot see, with practice described in standards such as ASTM D8120 and D8184.
Bench-top particle counter SLPC100: cleanliness grading and change-over verification
▍Wear Debris: What Is Actually Wearing
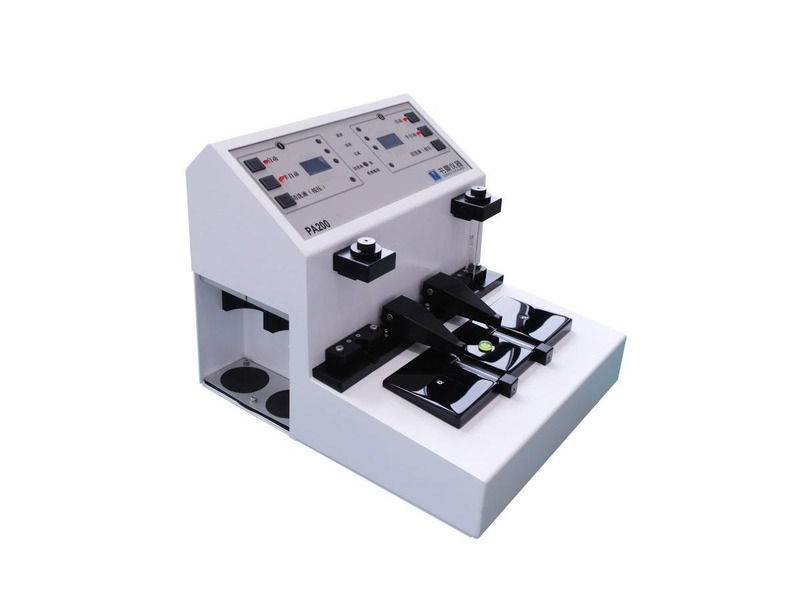
A ferrograph deposits particles onto a slide under ASTM D7690, and a microscope or a wear particle image analysis system reads the morphology. This turns "iron is rising" into "the wear is fatigue spalling, cutting, severe sliding or oxide", and each mechanism points you to a different repair. Image-based classification depends on a library of field samples, and applying it outside its training base still needs validation.
▍From Single Readings to a Trend Line
Readings become meaningful only as a series. One sample describes a moment, several describe a direction, and a direction plus a confirmed mechanism gives you a decision. A practical programme keeps every result for a unit on one trend line, so laboratory confirmations feed back into your baseline.
| Analysis step | Typical instruments | Where they work | Question they answer |
| Element screening | Oil spectrometer | Laboratory or mobile testing | Which metals are rising, wear or additive |
| Oil condition | Portable kinematic viscometer, portable oil tester, Karl Fischer titrator | Field and laboratory | Is the oil still fit, thicker, thinner or degraded |
| Contamination | Bench, portable and online particle counters, ferrous debris meters | Laboratory, field and online | Is cleanliness on target, is ferrous wear accelerating |
| Wear debris | Ferrograph, wear particle image acquisition and analysis system | Laboratory | Which wear mechanism, what to repair |
The other question that comes up just as often is whether to build this capability in-house or send samples out. Both routes work, and the choice comes down to whether you would rather spend money to save time, or time to gain coverage.
| Factor | In-house oil analysis | Outsourced oil analysis |
| Turnaround | Hours to a day | Days |
| Cost per sample | Low once the instrument is in place | A fee for every sample |
| Test breadth | Limited to the instruments on hand | Broad, including methods you would not buy for routine use |
| Data control | Direct, easy to combine with machine records | Depends on the provider's reporting |
| Capital and training | Instrument plus trained staff | Minimal |
How to Sample Engine Oil and How Often
Oil sampling is the first step of the whole exercise, and a poor sample defeats the best instrument.
• Fix your sampling point. Draw from the same location every time, normally a live oil line rather than a dead corner of the sump, or your readings will not be comparable.
• Fix your timing. Sample at operating temperature, when contaminants are evenly suspended, and run an idle machine before you sample.
• Avoid contamination. Use a clean, dry bottle, and flush the standing oil out of the sampling line before you fill it.
• Record the context. Note operating hours, make-up oil since your last sample, oil product and grade, and any recent repair.
• Send it promptly. Water and particle state change in storage, so get your sample to the laboratory without delay.
Container preparation and manual sampling can follow a practice such as ASTM D4057, whose scope does not extend to hydraulic fluids or insulating oils. For your specific engine, the manufacturer's sampling point and timing remain the final reference.
The manufacturer's interval is your starting point, and your first samples should come early enough to establish what normal looks like for that unit. In heavy-duty diesel service a routine interval of roughly 250 to 500 operating hours is a common starting point, to be treated as common practice rather than a standard value. The trend then moves your interval: you sample stable units less often, and moving ones more often.
Common Failures and the Oil Signatures They Leave
Every failure mode leaves a pattern, and the value of oil analysis is reading that pattern back to a cause.
| Failure mode | Oil signature | What confirms it | Typical action |
| Bearing or bushing wear | Copper, lead and tin rising alongside iron | Wear particle analysis showing sliding or adhesive wear | Inspect the bearing, check oil feed and alignment |
| Cylinder liner and ring wear | Iron and chromium rising, soot and blow-by up | Image analysis showing cutting or scuffing, soot by FTIR | Inspect liners and rings, verify air filtration |
| Fuel dilution | Viscosity and flash point falling | Fuel dilution by gas chromatography, ASTM D7593 | Inspect injectors and combustion, shorten the interval |
| Coolant ingress | Sodium and potassium with water, glycol detected | FTIR for glycol, water by Karl Fischer | Pressure test the cooler, check seals and gaskets |
| Dust ingress through the intake | Silicon rising with iron and aluminium | Particle morphology and intake inspection | Repair the intake path, shorten the interval |
| Over-extended drain | Viscosity rising, soot by FTIR, base number falling | FTIR soot and base number | Restore the correct interval, check injectors and EGR |
| Additive depletion | Calcium, zinc and phosphorus falling, acid number rising | Combined physico-chemical panel | Change the oil, confirm the correct product is in use |
| Water from condensation or washdown | Water rising, rust, elevated particle count | Karl Fischer water | Check breathers and duty cycle, review storage |
A signature is evidence, not a verdict. Each pattern points at a cause that you still have to confirm.
Analytical ferrograph PA200: depositing wear particles to read the wear mechanism
When a Result Looks Abnormal: The Response Ladder
An abnormal number is a question, and your response should eliminate cheap explanations before expensive ones.
1. Verify the sample before the machine. Sampling and handling errors account for a large share of anomalies, so check your sampling point, timing and bottle first.
2. Compare against the trend, not the value. A number that has moved sharply from that unit's own history deserves your attention even inside a generic table.
3. Read the indicators in combination. Element pairs, physico-chemical values and contamination data together point at a cause; a single value rarely does.
4. Confirm with the laboratory method. Where a field reading suggests fuel dilution, coolant ingress or a wear mechanism, confirm it before you act.
5. Decide and record. Your outcome is normally no action, a shorter interval, an inspection of a specific component, or a stop.
Note. A single exceedance is not a verdict. One result outside a limit calls for a re-sample or a confirmation test, not a teardown.
Best Practices for Heavy Equipment
What separates a programme that works from one that produces reports nobody reads is usually discipline, not instruments.
1. Fix the sampling point and timing for every unit, and write it down. Sampling variability is the largest single source of misleading data.
2. Use one laboratory and one set of methods across your fleet, because results from different methods are not comparable.
3. Build a baseline per unit or machine class. A fleet-wide table of normal values hides exactly the changes you want to catch.
4. Set attention and alarm limits statistically, using guidance such as ASTM D7669 and ASTM D7720, and keep the OEM specification as the ceiling.
5. Let the trend set your interval, and never run past the manufacturer's limit without evidence.
6. Verify repairs with a follow-up sample, keep the operating context with every result, and decide in advance what each alarm level should trigger.
Conclusion
Engine oil analysis turns a sample of oil into a maintenance decision: element, condition, contamination and wear particle data together show you whether the lubricant can stay in service and whether your machine is wearing abnormally, usually while the component is still repairable. On heavy equipment, where a stoppage is expensive and a sample is not, that is what turns unplanned failure into planned maintenance. Start with two or three units where failure costs you most, fix the sampling point and timing, and build a baseline from the first few samples. Soohow Instrument manufactures oil analysis instruments covering all four layers, from spectrometers and viscometers to particle counters and wear particle image analysis.
Frequently Asked Questions
Q | How Often Should Heavy Equipment Oil Be Analysed?
Start at the manufacturer's interval, take your first samples early to build a baseline, then let the trend move the interval: extend it for a stable unit, shorten it when a result moves.
Q | Is Engine Oil Analysis Worth It for a Small Fleet?
The more concentrated your fleet, the more clearly the arithmetic works, because each unit carries a larger share of the downtime cost. Start with your critical units and expand once the first results pay for themselves.
Q | Can Oil Be Tested on Site, or Must It Go to a Laboratory?
Viscosity, water, base number and ferrous debris screening suit on-site testing, while element analysis and wear particle attribution are better confirmed in a laboratory. Field screening finds the anomaly, and the laboratory defines it.
Q | How Do I Read an Oil Analysis Report?
Read the trend first and the absolute value second, then look at the indicators as a group. A value only means something against your unit's own history, and a single exceedance should be re-sampled before you act on it.
Q | Why Can a Report Show Normal Metals and the Machine Still Fail?
Element spectroscopy is generally insensitive to particles larger than about 10 microns, and serious wear produces exactly those particles. A ferrous debris measurement or a wear particle analysis closes that gap for you.
Ready to build a programme? Request a quote or talk to an engineer, and ask for the oil sampling checklist to get your first samples right.