APPLICATIONS · USED OIL ANALYSIS
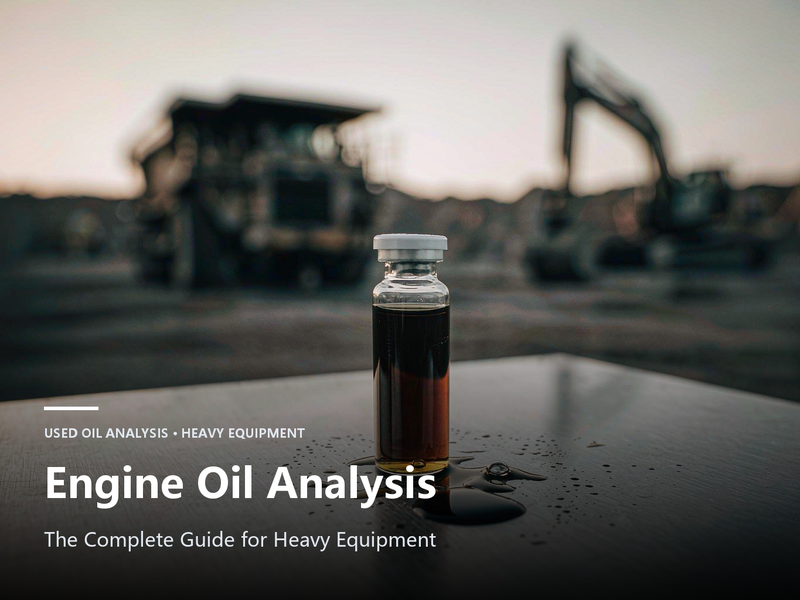
The trouble is that most equipment still changes oil by the calendar. Whether that oil had life left in it, or whether something inside was already tearing itself apart, nobody can really say. Used oil analysis closes that gap. It tells you how much life your oil has left, what is going on inside your machine, and whether you should act — before a failure picks the oil change date for you.
What Is Used Oil Analysis?
Used oil analysis means sampling the lubricant, hydraulic fluid or fuel already in service and using the results to answer two things: can this fluid keep working, and is anything inside the machine wearing abnormally or getting contaminated?
It is not the same as testing fresh oil in a lab. Fresh-oil testing asks whether a batch meets spec. Used oil analysis asks what the oil has become after time in service — how much life it has left, and whether you should act now.
It also gets confused with oil-change criteria. GB/T 7607-2010 *Criteria for changing of diesel engine oils* and GB/T 8028-2010 *Criteria for changing of gasoline engine oils* draw a floor: cross it and the oil must go. A trending program watches the curve that leads to that floor, and the early signals live in the stretch before it.
▍What Data Does Your Used Oil Reveal?
No single instrument carries the whole judgement. Atomic emission spectrometry can show that iron is present, but it goes blind above roughly ten micrometres. A particle counter can show the count is climbing, but it cannot tell incoming dust from metal shed inside. A complete picture needs several instruments covering for one another.
| Instrument group | What it measures | The question it answers for you |
| Oil spectrometers | Oil-soluble elements: wear metals, additive elements, contaminant elements | Is iron, copper or aluminium present? How much additive is left? Is that silicon dust or antifoam? |
| Bench and portable oil particle counters | Size-banded particle counts converted to a cleanliness code | Will the filter hold? Did cleanliness pass after the last oil change? |
| Online particle counters | Continuous online counting and cleanliness output at a set interval | Are particles trending up, or was that a one-off? |
| Ferrographs (analytical and direct-reading) | Magnetic separation and deposition of wear particles | Fine flakes or cutting swarf? And how much? |
| Wear particle imaging systems and ferrography microscopes | Particle imaging with automatic classification | Normal sliding wear, fatigue spalling, or cutting? |
| Ferrous index and ferrous debris meters (PQ-type) | Total ferrous debris burden | Is the iron from outside, or shed from inside? What did spectrometry miss? |
| Portable kinematic viscometers | Kinematic viscosity of clear and opaque oils | Thickened by oxidation, or thinned by fuel dilution? |
| Karl Fischer moisture titrators and TBN testers | Trace moisture and total base number | Has water got in? Is there enough alkalinity reserve to reach the next interval? |
| Portable density meters | Density and concentration | Mixed oils, dilution, or a wrong top-up? |
How to Take a Used Oil Sample
Get sampling wrong and every number downstream is wasted. Used oil analysis is stricter about sampling than most people expect.
• Sampling point. Draw from the return line, upstream of the filter, or a fixed point on the main circulating line — not the easy way through the drain plug or dipstick tube.
• Timing. Sample at normal operating temperature, with the oil circulating.
• Container. A clean, dedicated sample bottle, one bottle per sample — never decant from a larger container and reuse it.
• Records. Sample ID, date, running hours, last oil change — write them all down.
• Frequency. Sample more often on new or newly overhauled equipment until a baseline stands up, then set the interval by criticality.
Four Ways to Read a Used Oil Sample
An oil report puts dozens of numbers in front of you. Sort them, and there are only four lines — each answering a question of its own.
▍Elemental Spectrometry: Who Is Wearing, and How Much Additive Is Left
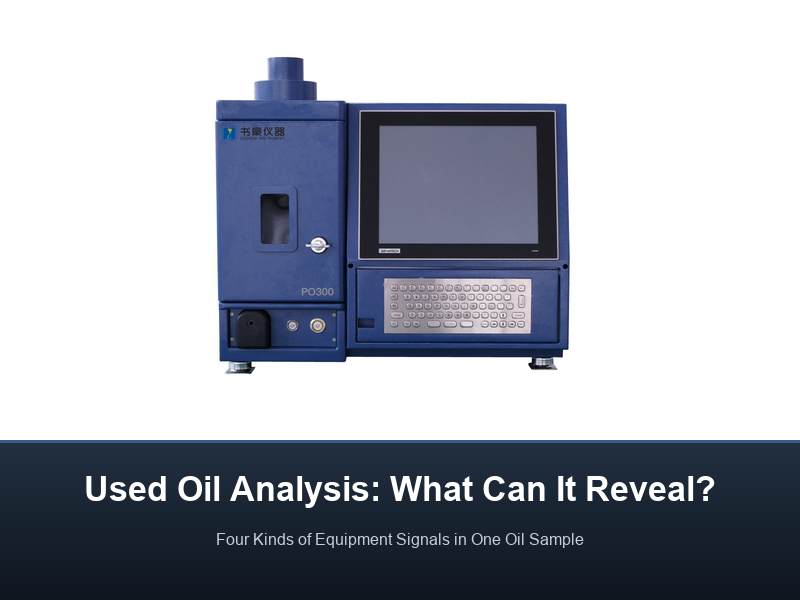
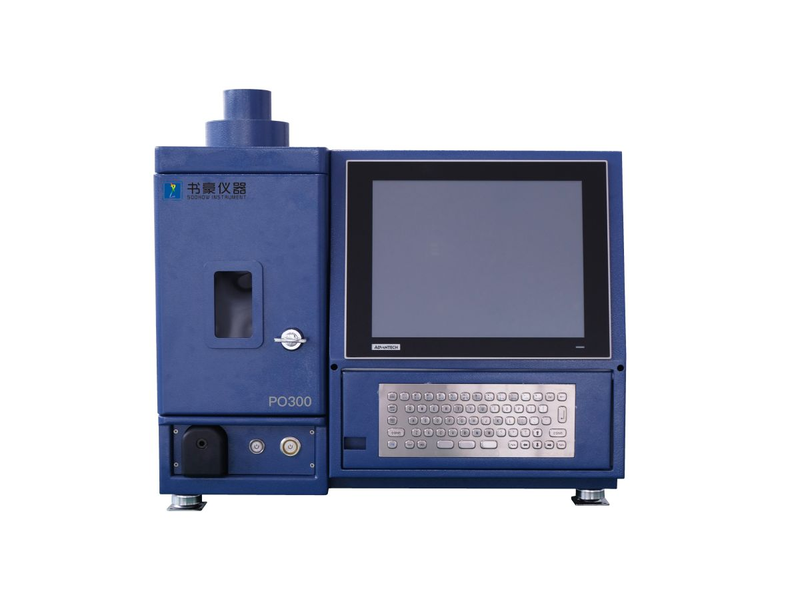
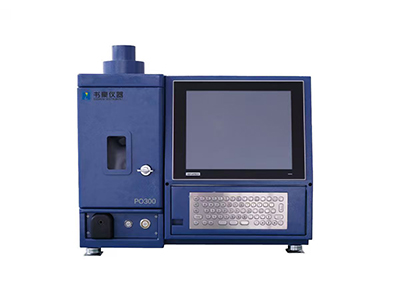
An oil spectrometer measures element concentrations by atomic emission. Rising iron, copper, lead or chromium points to a specific friction pair; silicon and aluminium climbing together usually means dust coming in from outside; calcium, zinc and phosphorus trace additive depletion. Method references include GB/T 17476-2023, NB/SH/T 0865-2013 and ASTM D6595-22. Its blind spot is just as clear — it reads oil-soluble elements only, so coarse particles slip past. Oil testing uses it to read the elements; coarse particles need another line.
Oil spectrometer: measuring elemental concentrations
▍Particle Counting: How Dirty Is the Oil?
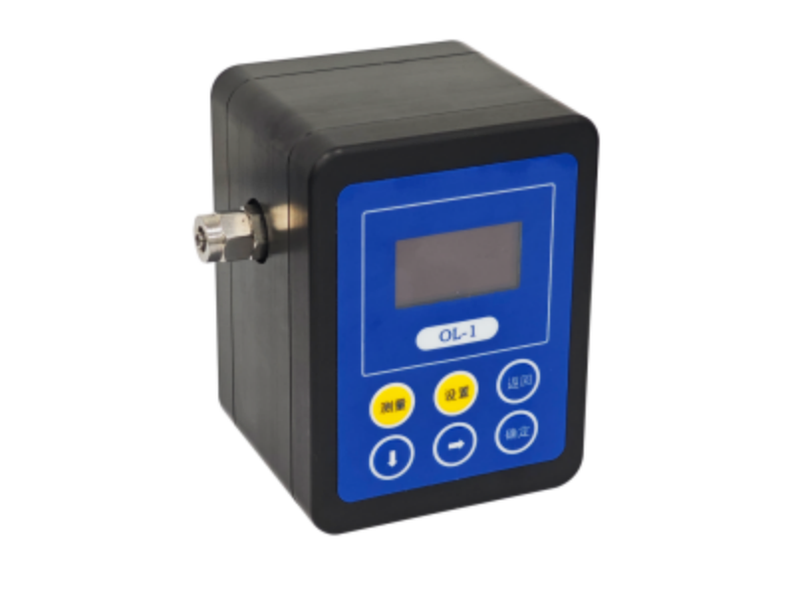
A particle counter bins particles by size and converts the result into a cleanliness code; ISO 4406, GB/T 14039-2002 and NAS 1638 are the systems you will meet most often. Its most direct use here is verifying filtration and signing off an oil change — if freshly filled oil fails the code, the filter or the top-up is usually to blame.
Inline particle counter: continuous cleanliness monitoring
▍Particle Morphology: What Do the Particles Look Like?
Counting tells you how many; it says nothing about shape. Ferrography lays ferrous particles down along a magnetic gradient onto a slide, then puts them under a microscope — normal sliding wear leaves thin flakes, cutting wear leaves curled swarf, fatigue spalling leaves thick, bright-edged plates. SH/T 0573-1993 is the reference for analytical ferrography. In oil testing, this is the line that answers how the wear is actually happening.
Wear particle chains on a ferrogram
▍Ferrous Debris and Fluid Properties: Catching the Coarse Particles
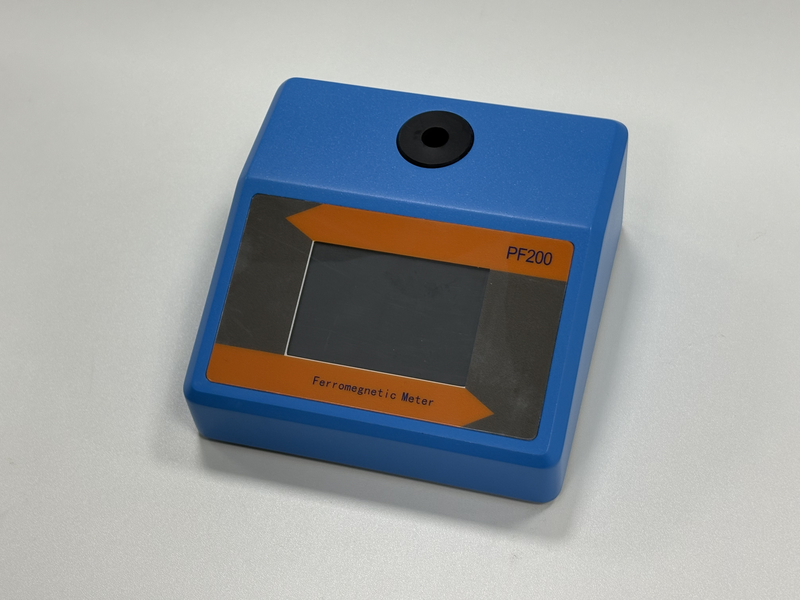
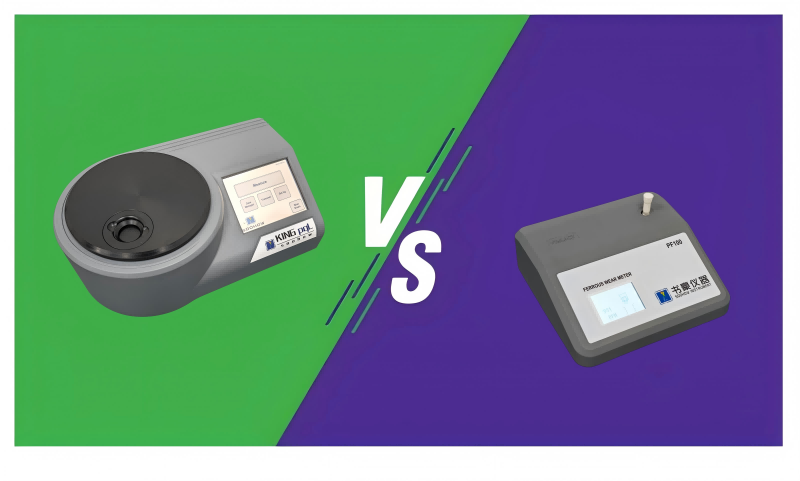
Ferrous index meters (the PQ index) and ferrous debris meters measure total ferrous debris and barely care about particle size — exactly the gap spectrometry leaves open, backed by ASTM D8120-25 and ASTM D8184-18e1. Fluid properties form another group: kinematic viscosity (ASTM D445, ASTM D7279, NB/SH/T 0956-2017) tells oxidation thickening from dilution thinning; moisture and total base number show how much reserve is left; density (ASTM D7777-24) catches mixed oils and wrong top-ups. None of it is new, but an oil testing program without these leaves a corner of the judgement missing.
Portable ferrous debris meter: covering what spectrometry misses
What Can Used Oil Analysis Find?
Put the four lines against real problems, and here is what a used oil analysis can surface.
| Indicator | The equipment problem it may point to |
| Iron rising, with total ferrous debris rising in step | Accelerated normal wear at gears, cylinder liners or bearings |
| Copper and lead rising together | Copper-alloy bearing or bushing wear, often from poor lubrication or overload |
| Silicon and aluminium rising together | External dust ingress — check intake, breathers and seals |
| Sodium or potassium up, with moisture also up | Coolant leakage; ethylene-glycol types can be confirmed via NB/SH/T 6077-2023 |
| Cleanliness code out of limit | Failed filter, contaminated top-up, or internal shedding already under way |
| Cutting-type particles present | Hard debris has entered a friction pair and is scoring it |
| Viscosity falling steadily | Fuel dilution (NB/SH/T 6073-2023) or the wrong oil |
| Base number dropping fast | Accelerated oxidation — not enough remaining life |
| Insolubles rising (GB/T 8926-2012) | More oxidation products and carbon, raising sludge risk |
Note: always set limits against the equipment maker's requirements and the applicable standard. A single number means nothing without the oil type, the operating conditions and the sampling history behind it.
How to Judge Machine Condition From Trending Data
A single reading only says what is happening now; a trend shows where things are heading. Three situations turn up again and again in your day-to-day testing.
▍Ferrous Debris Is Climbing, Spectrometry Says Nothing
The PQ index climbs for three intervals in a row while spectrometry reports iron essentially flat; total ferrous debris has nearly doubled (example). Large particles are building up, and spectrometry is not sensitive to them.
That combination is the clue: pull a sample for ferrography and look at the shapes. Cutting swarf or fatigue plates decides whether you stop your machine or keep watching it — and after a test like this, the worst move is to see "numbers look fine" and file it away.
▍The Cleanliness Code Jumps a Step
Particle counts in a hydraulic system jump two codes above normal while operating parameters look perfectly fine, with the sharpest rise above 5 μm (example). A new contamination source has appeared — most likely a top-up, a breather, or a freshly fitted filter.
Recheck your top-up records and filter batches, then run a before-and-after cleanliness comparison on your system. Do not rush into an oil change; find the source first — that is what oil condition monitoring is for in the first place.
▍Viscosity Dropped, Iron Looks Normal
Viscosity falls a grade against the last interval, flash point edges down, iron and copper barely move (example). This is not wear; the oil has been diluted.
Look at the same two numbers from another angle and your conclusion flips — that kind of discrimination is what is worth watching for in oil condition monitoring, more than any single value.
What Does Used Oil Analysis Do for Maintenance?
Run a full oil test and what you get is never a single number — it is three separate jobs joined up.
The most direct one is the drain interval. If the oil still has life, keep it in — you save not only oil, but downtime and disposal cost.
More important still is moving failure from after to before. By the time a vibration or temperature alarm trips, the damage has usually already formed; what shows up in the oil moves far earlier.
The easily overlooked one is settling responsibility. Keep a baseline before an overhaul, test again after, and whether wear accelerated, assembly was at fault, or the oil itself was wrong — data ends the argument faster than opinion.
Frequently Asked Questions
Q | How Often Should You Perform Used Oil Analysis?
There is no universal interval. Critical assets are sampled on fixed running hours; new or newly overhauled machines are sampled more densely until the baseline is set. Once the interval is fixed, do not keep changing it — trends are only comparable at a steady cadence.
Q | Should You Test Fresh Oil as Well?
Yes. The fresh-oil results are the baseline for the whole used oil analysis; without them, a later "rise" has nothing to compare against.
Q | Can You Skip Ferrography and Rely on Spectrometry Alone?
It covers most routine wear, but coarse particles will be missed — and in used oil analysis, that kind of miss is the one thing you can least afford.
Q | If the Cleanliness Code Fails, Must You Change the Oil?
Not necessarily. A failing code means the oil is dirty, not that it is degraded. Establish the source first — filter, top-up practice, or internal shedding. In most cases filtration and a filter change, re-verified against NB/SH/T 6072-2023, restore the system.
Q | Is Scatter in the Data a Sign of a Bad Instrument?
Check sampling first. Same location, same temperature, same technique is what makes results comparable. Change the technique and the conclusions you draw drift with it.
Conclusion
In the end, used oil analysis reads a fluid sample as a health report for the machine: the elemental line shows who is wearing, the particle line shows how dirty the oil is, the morphology line shows how the wear is happening, and the fluid-property line shows how much life is left. Put the four together and you can act before a fault takes shape.
Soohow Instrument builds its oil testing range around exactly those four lines.
Ready to build a used oil analysis routine? Fix the sample point, the sampling time and one-bottle-per-sample first, and let a steady baseline drive the drain decisions. Contact Soohow Instrument for instrument selection and test-plan design.